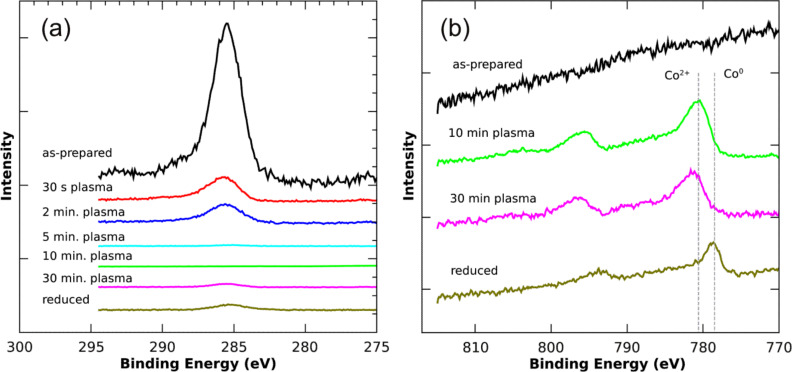
Figure 5.
Photoelectron spectroscopy of Co-precursor loaded PS(1779)-P2VP(857) reverse micelles after different O and H plasma treatments. Details are given in the text; (a) and (b) show C-1s and Co-2p levels, respectively. All spectra are normalized to the Si-2p substrate signal intensity (not shown) and vertically off-set relative to each other for clarity.

