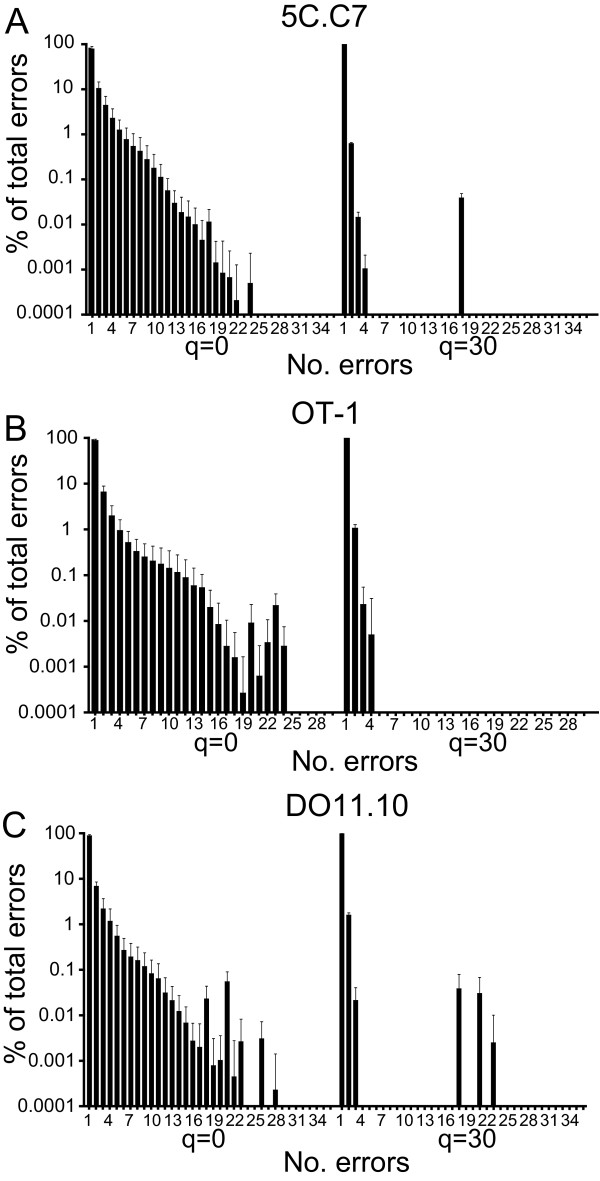
Figure 3.
Multiple errors in CDR3 sequences. Plot shows mean+1 s.d. of the frequency of correct-length erroneous sequences with the indicated number of nt substitutions as a percent of the total correct-length erroneous sequences for the 5C.C7 (A), OT-1 (B), and DO11.10 TCR, and with phred cutoff scores of 0 or 30.

