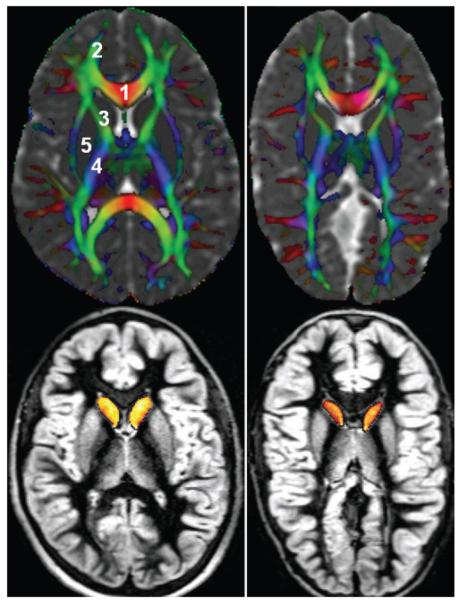
Fig. 1.
Representative images of the regions used for DT imaging quantification obtained in a child from the control group (left) and a child with SB (right). The upper panels show a principal vector map modulated by FA and fused by the mean diffusivity to highlight CSF. Commissural (right-to-left) fibers appear red, association pathways green, and projection fibers blue. Cortical and deep gray matter appears gray in the upper panels and bright gray in the lower panels. The caudate nuclei are shown as yellow/orange in the lower panels. 1 = genu of the corpus callosum; 2 = minor forceps; 3 = anterior limb of the internal capsule; 4 = posterior limb of the internal capsule; 5 = putamen.

