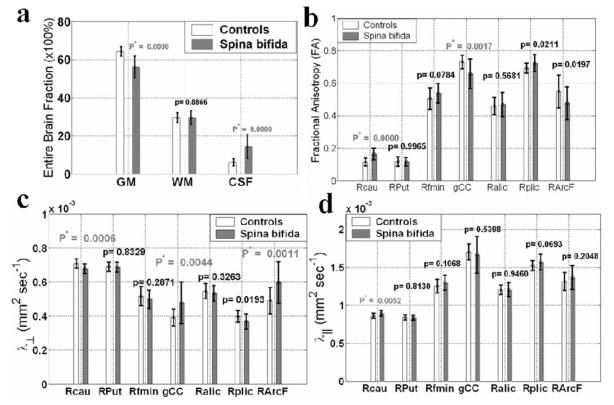
Fig. 2.
Bar graphs. a: Whole-brain DT imaging of gray matter (GM), white matter (WM), and CSF fractions (× 100%; means ± SDs) in the age-matched SB group (29 children) and control group (20 children). b: Region-of-interest DT imaging comparisons of FA in both groups. The ROIs selected include the right caudate head (Rcau), right putamen (RPut), right forceps minor (Rfmin), genu of the corpus callosum (gCC), right anterior and posterior limbs of the internal capsule (Ralic and Rplic, respectively), and the right arcuate fasciculus (RArcF). c: Region-of-interest DT imaging group comparisons of transverse diffusivities (λ1) in both groups. d: Region-of-interest DT imaging group comparisons of axial diffusivities (λ⊥) in both groups. The group means ± SDs are shown along with the corresponding probability values.

