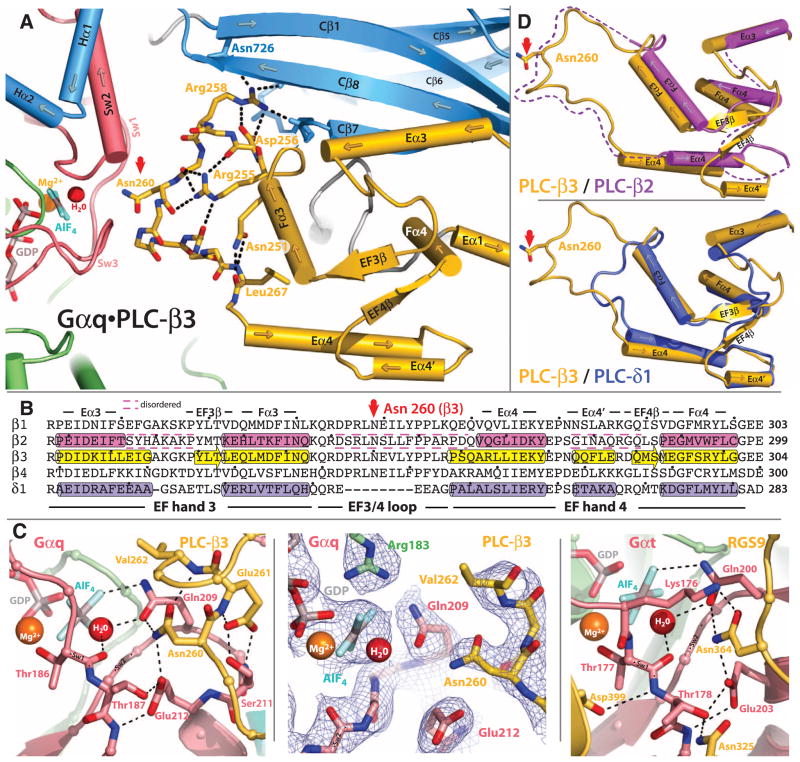
Fig. 4.
Interaction of the EF3/4 loop of PLC-β3 with switch residues critical for GTP hydrolysis by Gαq. (A) Ribbon and cylinder diagram highlighting conserved interactions within EF hands 3 and 4 (yellow) of PLC-β3 needed for the optimal positioning of Asn260 (red arrow) within the guanine nucleotide binding pocket of Gαq. Sw1 to Sw3 are pink; other portions of Gαq are green. The C2 domain and adjacent Hα1/Hα2 of PLC-β3 are light blue; key PLC-β3 residues (sticks) and hydrogen bonds (dotted lines) that support Asn260 (red arrow) are highlighted. The guanine nucleotide binding pocket contains GDP and AlF4− (sticks) as well as the Mg2+ cofactor (orange ball) and catalytic water (red ball). (B) Sequence alignment comparing EF hands 3 and 4 of PLC-βs with equivalent region of PLC-δ1. α helices (cylinders) and β sheets (arrows) assigned from crystal structures (PLC-β3, 3OHM; PLC-β2, 2ZKM; δ1, 1DJX); dashed lines bracket disordered regions. The asparagine (Asn260 in PLC-β3) that is positioned for promotion of GTP hydrolysis by Gαq is indicated by a red arrow. The colors correspond to those of the structures depicted in (D) below. Dots indicate every 10th residue. (C) Comparison of the GTP-binding sites of Gαq•PLC-β3 and Gαt•RGS9. Left image depicts portions of the EF3/4 loop (yellow) of PLC-β3 contacting Sw1 and 2 (light red) of Gαq. Other portions of Gαq are shown as in (A). Middle image highlights electron density (composite simulated annealing omit map contoured at 1.2 σ) centered on Asn260 of Gαq•PLC-β3. Right image depicts analogous portions of RGS9 (yellow) bound to Gαt as revealed in the crystal structure determined by Slep et al. (23). (D) Ribbon and cylinder diagrams comparing EF hands 3 and 4 of PLC-β3 (yellow) with PLC-β2 (top, magenta) and PLC-δ1 (bottom, purple). Asn260 highlighted with red arrow, and dotted lines indicate disordered portions of PLC-β2.

