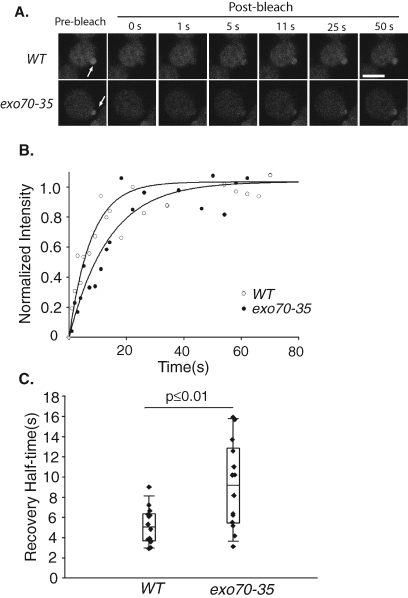
FIGURE 2:
Targeting of Cdc42p to the bud is delayed in the exo70-35 cells. GFP-Cdc42p fluorescence at the daughter cell was bleached, and the recovery of the fluorescence signal was monitored over time. (A) Montages of FRAP of the wild-type and exo70-35 cells. The GFP-Cdc42p fluorescence recovers slower in the exo70-35 mutant cell. Arrows point to the regions of photobleaching. Scale bar represents 2 μm. (B) Fitting curves of one set of FRAP experiments on the wild-type and exo70-35 cells. The normalized fluorescence intensity is plotted over time. The curve fitting was performed using SigmaPlot as described in Materials and Methods. (C) Recovery half-times for the wild-type and exo70-35 mutant cells were plotted. Bottom and top of the box are the lower and upper quartiles, respectively. The band near the middle of the box is the median. Whiskers represent standard errors. n = 14, p ≤ 0.01.

