FIGURE 1:
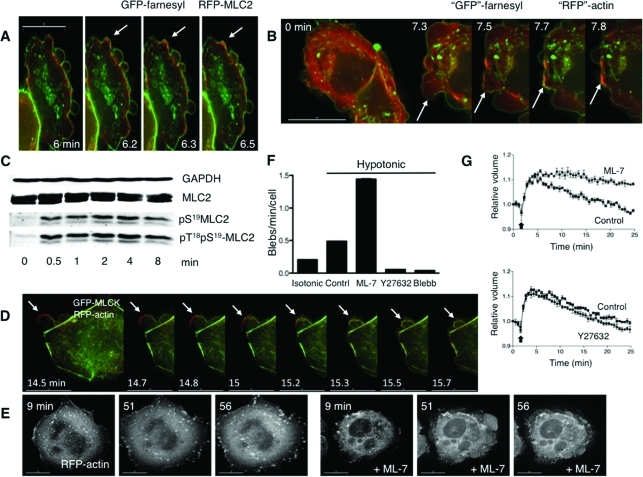
Roles for MLCK in bleb dynamics and cell volume recovery. (A) Sequential stills from a live imaging study of swollen cells transfected with farnesyl-GFP (green), to mark membranes, and RFP-MLC2 (red), to mark myosin II. Arrows mark a bleb that retracts. (B) Sequential stills from a live imaging study of cells transfected with farnesyl-RFP (pseudocolored green) and GFP-actin (pseudocolored red) and then swollen. Arrows mark a bleb that retracts. The scale bar in all images is 15 μm, and the time (in min) indicates duration of hypotonic exposure. (C) Cell swelling induces increases in phosphorylation of the regulatory light chain of myosin II (MLC2). Representative immunoblot for MLC2 and its phosphorylated forms in response to hypotonic exposure. Whole cell lysates were prepared from cells swollen for the times denoted. (D) Stills from live images in cells transfected with RFP-actin (red) and GFP-MLCK (green) show that MLCK is recruited to blebs before their retraction. An arrow marks a spot where a bleb retracts. (E) Stills at early and late time points in a live imaging study of swollen cells transfected with RFP-actin show that inhibition of MLCK with ML-7 (10 μM) leads to persistent blebbing far beyond the typical time of volume recovery (see graphs in G). (F) Effects of inhibitors of MLCK (ML-7), ROCK (Y27632), and myosin II (blebbistatin) on swelling-induced blebbing. Depicted are numbers of blebs per min per cell under isotonic conditions (far left) and with hypotonic exposure in the absence (Contrl) or presence of ML-7 (10 μM), Y27632 (10 μM), or blebbistatin (Blebb, 30 μM). (G) Effects of ML-7 (top, 10 μM) and Y27632 (bottom, 10 μM) on cell volume compared with no inhibitor present (Control), after hypotonic exposure. An arrow marks the switch to hypotonic exposure. Data were compiled from at least three experiments for each condition.

