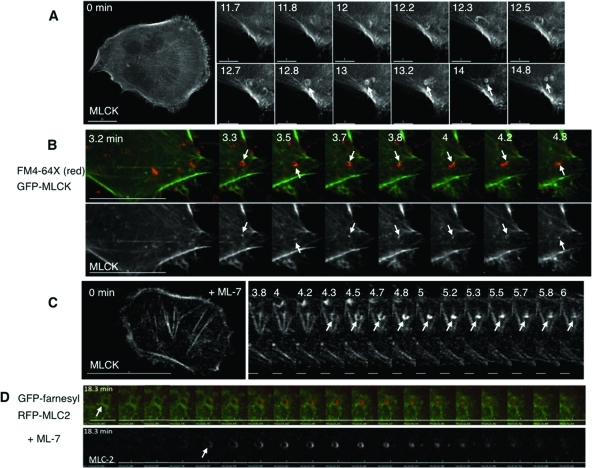
FIGURE 10:
Dynamic behavior of MLCK and myosin II in swelling-induced rings. (A) Stills from a cell expressing GFP-MLCK, imaged before and after hypotonic exposure. The left panel shows the whole cell at 0 min (scale bar, 15 μm); the right panel shows a magnified region of the base at different times (in min) after hypotonic exposure (scale bar, 5 μm). An MLCK comet tail appears to form a ring (marked by an arrow), which persists for 2 min. (B) The top panel shows stills from a cell expressing GFP-MLCK (green) undergoing hypotonic exposure in the presence of FM4-64X (red). The bottom panel shows MLCK signal alone. An arrow marks a focus of MLCK signal that moves around an FM4-64X ring within 1 μm above the base of the cell. Scale bar is 15 μm. (C) In the presence of ML-7, MLCK rings can be seen to constrict slowly. The left panel shows the base of a GFP-MLCK–expressing cell just prior hypotonic treatment, and the kymograph in the right panel represents an enlarged region of the cell base with sequential images acquired at the indicated times (in min) after hypotonic exposure in the presence of ML-7 (10 μM). The arrow highlights the appearance and constriction of an MLCK ring in that cell. (D) Kymographs derived from sequential images (acquired every 10 s) of the base a cell expressing RFP-MLC2 (red) and GFP-farnesyl (green), exposed to hypotonic medium in the presence of ML-7 (10 μM). The arrow in the top panel highlights the formation of an MLC2/farnesyl ring that slowly constricts. The lower panel shows the MLC2 signal alone. Scale bar is 5 μm.

