FIGURE 2:
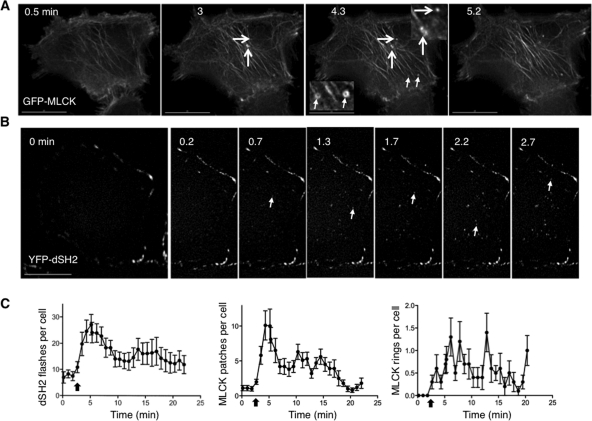
Swelling induces localization of MLCK to foci at the base of the cell, where focal transient tyrosine phosphorylation events are detected. (A) Selected stills from a swollen cell expressing GFP-MLCK show the appearance and disappearance of rings and patches. Representative patches are marked with larger arrows; representative rings are marked with smaller arrows. Insets at higher magnification are marked with the same arrows. (B) Stills taken at the base of a cell overexpressing YFP-dSH2 before and after hypotonic exposure. Arrows mark new dSH2 flashes, sites of tyrosine phosphorylation, at each time point. Time (in min) indicates duration of hypotonic exposure. (C) Graphs of the number of YFP-dSH2 flashes per cell (left) and the number of GFP-MLCK patches (middle) and rings (right) per cell as a function of time. The kinetics of the dSH2 flashes and MLCK patches follow a similar time course. Scale bars are 15 μm.

