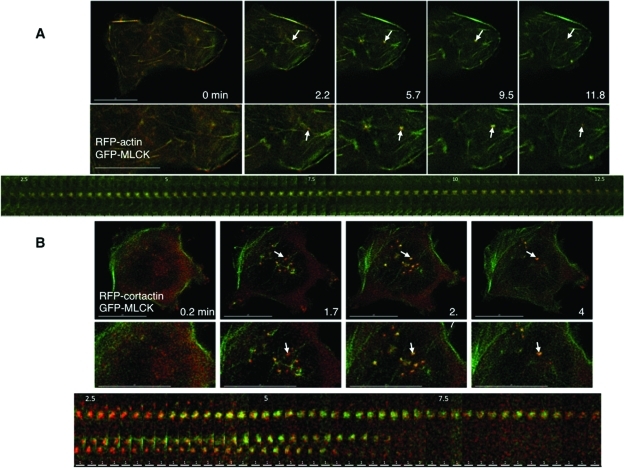
FIGURE 4:
Actin and cortactin transiently localize with MLCK at the base of the cell in response to swelling. (A) Stills from live imaging of cells transfected with GFP-MLCK and RFP-actin are depicted at different times (in min) after hypotonic exposure and show simultaneous appearance and disappearance of MLCK (green) and actin (red) to patches at the base of the cell. A patch that is transiently induced by cell swelling is marked with an arrow. A kymograph of the patch indicated in the magnified insets is shown below. (B) Stills from live images of cells transfected with GFP-MLCK (green) and RFP-cortactin (red) at different times (in min) after hypotonic treatment. The midsection of each cell base is magnified below. An arrow indicates simultaneous GFP-MLCK and RFP-cortactin accumulation in patches in response to cell swelling. A kymograph including the patch indicated in the magnified insets is shown below; the top patch is the one marked with an arrow above. Scale bars are 15 μm for the top panels of (A) and (B). The scale bars in the kymograph in (A) are 2 μm and in the kymograph in (B) are 1 μm.

