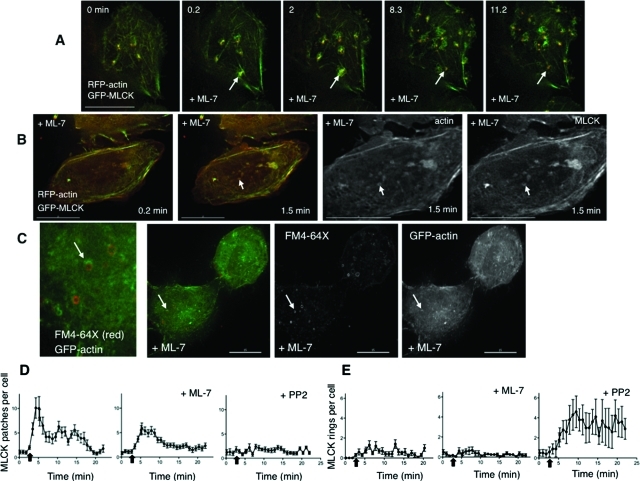
FIGURE 6:
Inhibition of MLCK and of Src have distinct influences on patch and ring dynamics. (A) Stills from live imaging of the base of cells that were transfected with GFP-MLCK (green) and RFP-actin (red) and treated with the MLCK inhibitor ML-7 (10 μM) during hypotonic exposure (time in min). The arrow marks a transient MLCK patch for which the actin recruitment, accumulation, and departure parallel that of MLCK. The arrow in (B) marks an MLCK ring that also contains actin. Shown in the right two panels are the single channel signals for actin and MLCK at higher magnification of the 1.5-min time point. (C) Cells transfected with GFP-actin (green) were treated with exogenous FM4-64X (red) during hypotonic exposure in the presence of ML-7 (10 μM) and then fixed. Rings of actin and rings of FM4-64X membrane dye are seen alone and associated at the base of the cell (a magnified view is shown in the leftmost panel). An arrow marks an FM4-64X membrane ring on which actin partially surrounds the membrane ring. Shown in the right two panels are the single channel signals for FM4-64X and GFP-actin. Scale bars are 15 μm. (D) Graphs of the number of GFP-MLCK patches per cell, comparing hypotonic exposure in the presence and absence ML-7 (10 μM) or PP2 (10 μM) as a function of time. (E) Graphs of the number of GFP-MLCK rings per cell comparing hypotonic exposure in the presence and absence of ML-7 (10 μM) or PP2 (10 μM) as a function of time. Data in the leftmost graphs (absence of inhibitor) in panels D and E correspond to data presented in Figure 2C. All complete scale bars are 15 μm.

