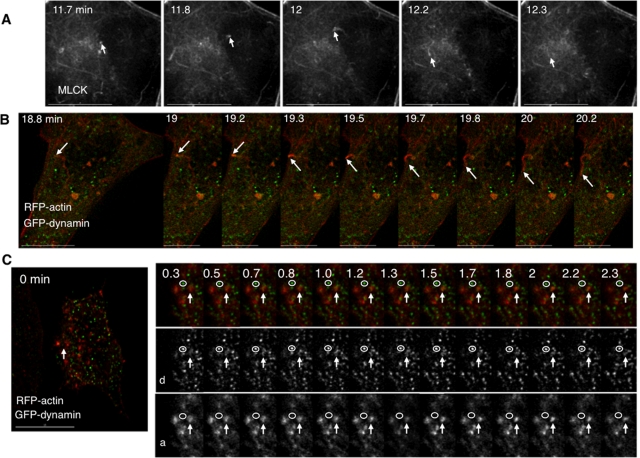
FIGURE 8:
Cell swelling elicits formation of MLCK and actin comets. (A) Sequential stills from the base of a swollen cell expressing GFP-MLCK. An arrow points to a comet that arises and disappears. (B) Sequential stills from a cell expressing GFP-dynamin (green) and RFP-actin (red) during hypotonic exposure. An arrow marks an actin comet tail formed in response to cell swelling. (C) Sequential stills from a cell expressing GFP-dynamin (green) and RFP-actin (red) before and after hypotonic exposure. An arrow marks the position of an actin patch structure, the signal of which intensifies with cell swelling. A magnified view of that part of the cell includes the actin patch (arrow) and a punctum of dynamin that does not change on swelling or measurably localize with actin (circle). Single channel series depicting dynamin (d, middle) and actin (a, bottom) are below. Time (in min) indicates duration of hypotonic exposure. Scale bar is 15 μm except in B, where only the scale bar in the first panel is 15 μm.

