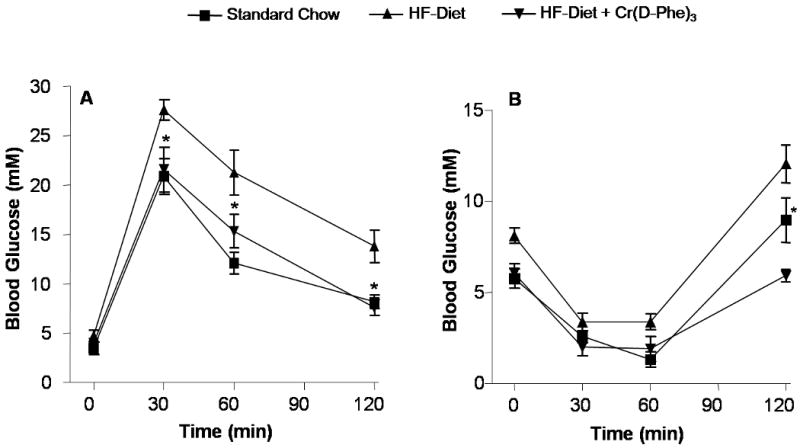
Figure 2.

Effect oral supplementation with Cr(d-Phe)3 on glucose tolerance. (A) Blood glucose concentrations following glucose challenge (1 g/kg) at different time points. Values are means ± SEM (n = 8-12 per group), and *p < 0.05, compared to high-fat-fed, vehicle treated mice. (B) Blood glucose levels following insulin challenge (1.5 IU/Kg). Data are represented as means ± SEM (n = 8-12), *p < 0.01 compared to high-fat-fed, vehicle-treated mice.
