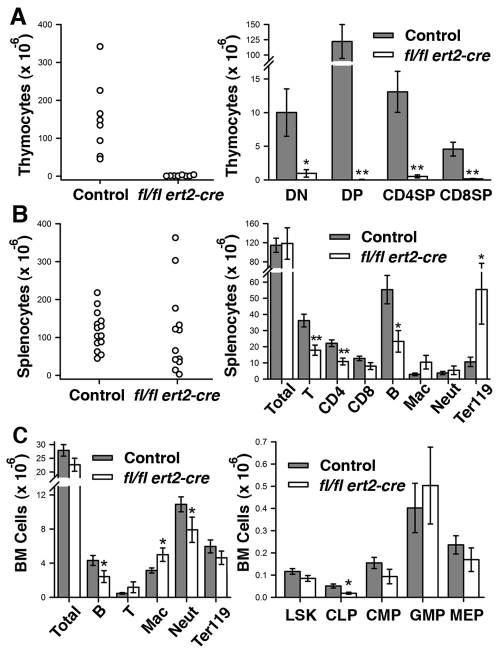
Fig. 3.
Altered hematopoiesis in induced SHP-2-deficient mice. (A) Numbers of total thymocytes (left) and indicated thymocyte subpopulations (right) in thymi isolated from tamoxifen-injected moribund ptpn11fl/fl ert2-cre mice (n=8) and littermate controls (n=8). DN, CD4–CD8–double negative; DP, CD4+CD8+ double positive; SP, CD4+CD8– and CD4–CD8+ single positive T cells. (B) Numbers of total splenocytes (left) and indicated splenocyte subpopulations (right) in spleens isolated from tamoxifen-injected moribund ptpn11fl/fl ert2-cre mice (n=12) and littermate controls (n=14). T cells (T), B cells (B), macrophages (Mac) and neutrophils (Neut) were identified as TCRβ+, B220+, CD11bint/GR1int and CD11bhi/GR1hi, respectively. Ter119+ cells represent erythrocyte precursors. (C) Total numbers and numbers of indicated lineage-positive cells (left) and numbers of indicated lineage-negative progenitor cells (right) in bone marrow of tamoxifen-injected moribund ptpn11fl/fl ert2-cre mice and littermate controls (for each genotype, n=11 for lineage-positive and n=5 for lineage-negative). LSK, Lin−Sca-1+c-Kit+ cells, which are enriched for HSCs; CLP, Lin−Sca-1loc-KitloCD127+; CMP, Lin−Sca-1−c-Kit+CD34+CD16/32lo; GMP, Lin−Sca-1−c-Kit+CD34+CD16/32hi; MEP, Lin−Sca-1−c-Kit+CD34−CD16/32–/lo. In scatter plots, each symbol represents an individual mouse. In bar graphs, the mean ± 1 s.e.m. is depicted. All mice were injected with tamoxifen at 6–8 weeks of age. Age range of mice at time of analysis was 10–16 weeks. Statistical significance was determined by two sample Student’s t-test. *P<0.05; **P<0.005.

