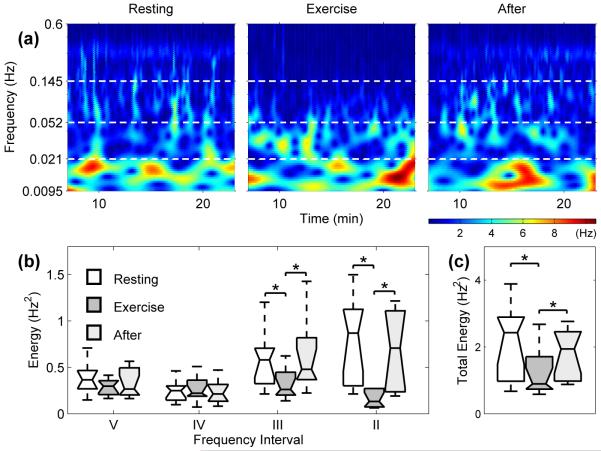
Fig. 4.
(a) Wavelet transform showing the time-frequency domain of the HRV for subject 4 during RE, EX and AE. For all 10 subjects we have (b) box plots showing the energy of the wavelet transforms of HRV in different intervals (see Table 2) and (c) the total energy within the interval 0.0095 – 0.6 Hz. The horizontal lines of the box plots indicate the 10th, 25th, 50th, 75th and 90th percentiles, with outliers not plotted. Significant changes of p < 0.05 are denoted by *.

