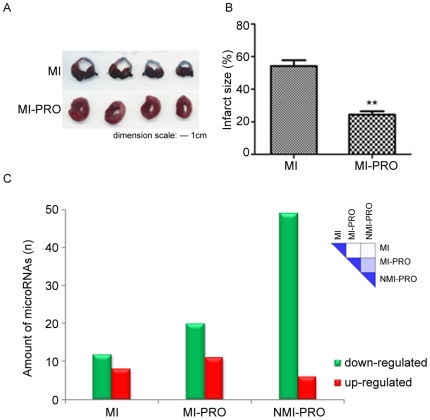
Figure 1. Effects of propranolol on the infarct size and miRNAs expression.
A. Effects of propranolol on the infarct size in rats with myocardial infarction. Left panel: the white portion of the coronal sections of the left ventricular wall represents the infarct area. Right panel: the size of infarct area was expressed as the percentage of a standard coronal section. **p<0.01 vs. MI (two-way paired t-test), n = 5. B. Count of miRNAs with expression levels varied by at least ±0.5 from the levels in Control. The right upper heatmap shows the miRNA expression similarity between groups. MI, myocardial infarction; MI-PRO, myocardial infarction-propranolol; NMI-PRO, non-myocardial infarction-propranolol. C. Quantification of miR-1 expression. Relative level of miR-1 normalized to control; ***p<0.0001 vs. control; ##p<0.01 vs. MI (two-way paired t-test), n = 8.

