
Figure 4.
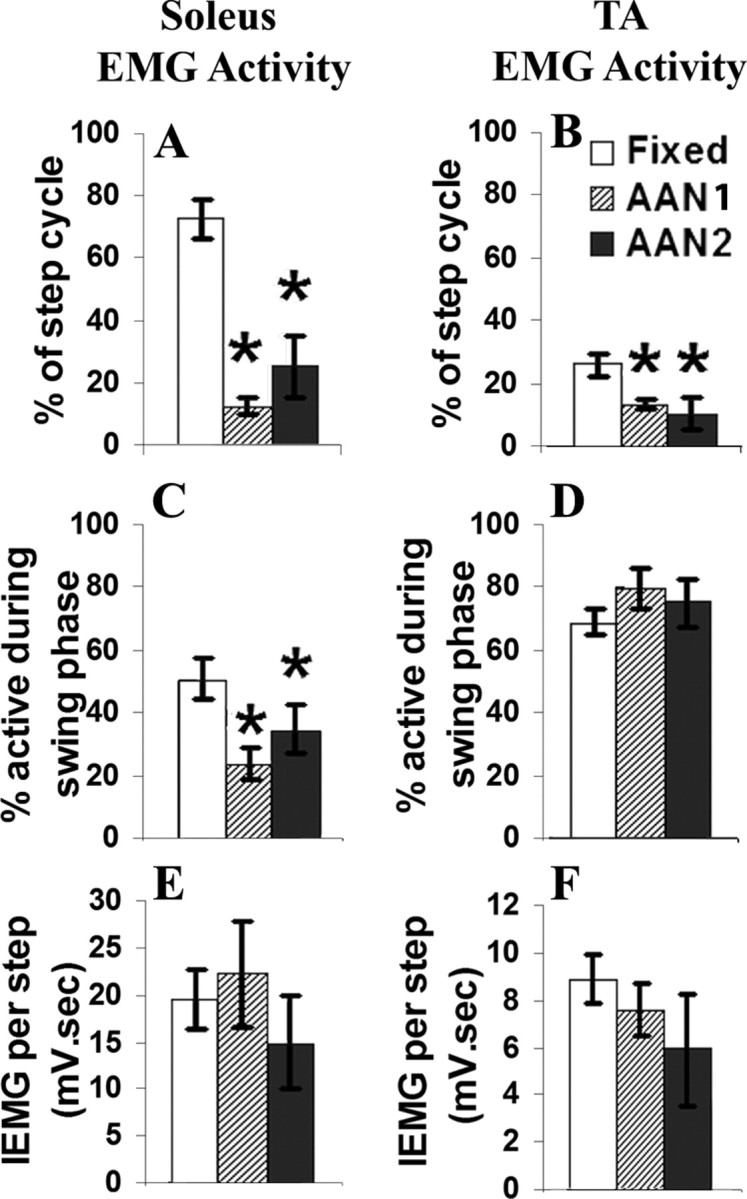
A and B show the percentage of the entire step cycle that the EMG bursting is present in the soleus and TA muscles within the fixed-trajectory and AAN paradigm groups. C and D show the duration of the EMG bursting that occurs during the swing phase of the step. E and F show the integral of the EMG during the entire step cycle. Values are mean ± SEM for 20 s of movement for eight rats per group. *p < 0.05, significantly different from the fixed-trajectory group.