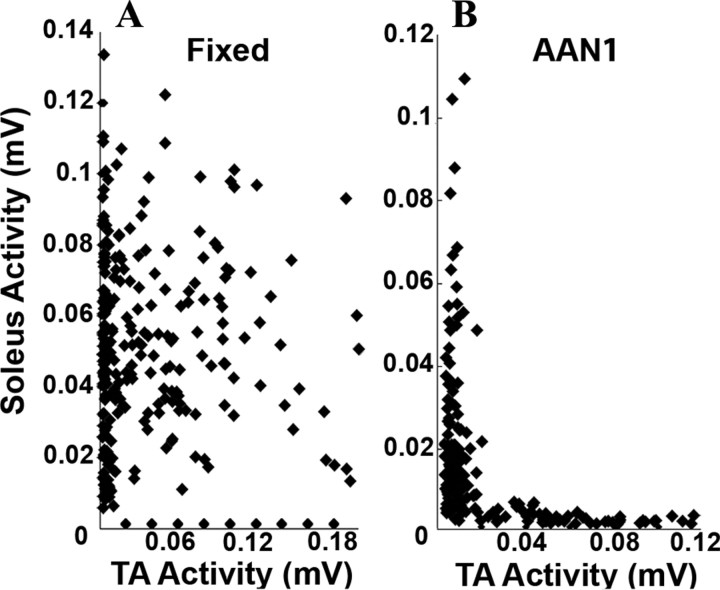
Figure 5.
A and B show examples of joint probability distributions (see Materials and Methods) comparing the EMG of the soleus and TA muscles for the fixed-trajectory and AAN paradigms, respectively, of a single rat. The coordination coefficient for this rat was 0.15 during the fixed trajectory and 0.04 during the AAN testing. Values in all graphs are from 20 s of movement for eight rats per group.

