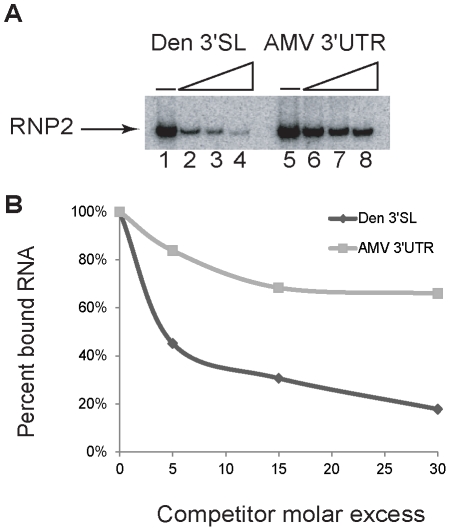
Figure 2. Binding specificity assessed by competition.
(A) Electrophoretic mobility shift assay of a competitive RNA binding analysis. All reactions contained the same amount of radiolabeled dengue 3′ SL RNA and included the same volume of 500 mM affinity column chromatography eluate. Lanes 1 and 5 represent dengue 3′SL RNA plus protein extract, showing RNP2 without added competitor RNA. Lanes 2–4 represent competitor dengue 3′SL RNA added at 5, 15, and 30-fold molar excesses. Lanes 6–8 represent addition of competitor AMV 3′UTR RNA at a molar excesses of 5, 15 and 30 fold. (B) Quantification of labeled RNA in the bound fraction (RNP 2) from panel A normalized relative to the total amount of RNP2 in the absence of competitor (lanes 1 and 5, respectively). Upper trace: AMV 3′UTR RNA competitor; lower trace: dengue 3′ SL RNA competitor.

