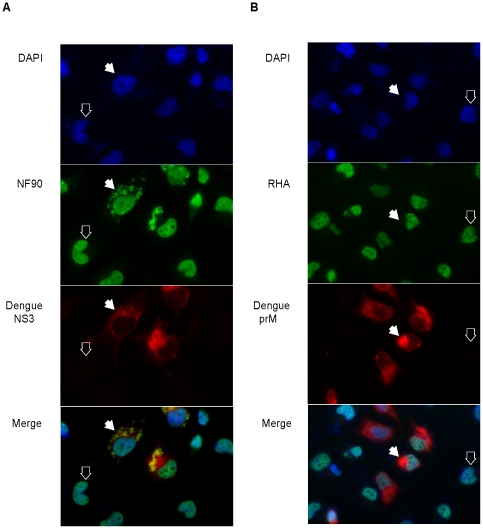
Figure 4. RHA and NF90 intracellular localization in uninfected and dengue virus-infected cells.
Open arrows point to representative uninfected cells; filled arrows point to representative cells infected by dengue virus. (A) Cells were stained with the nuclear stain DAPI, with anti-NF90 mouse monoclonal antibody, and anti-dengue virus NS3 rabbit polyclonal antibodies. The merge panel shows an overlay of the DAPI, NF90 and NS3 signals. (B) Cells were stained with the nuclear stain DAPI, with anti-RHA rabbit polyclonal antibodies, and anti-dengue prM mouse monoclonal antibody. The merge panel shows an overlay of the DAPI, RHA and prM signals. Different dengue antibodies were used in panels A and B because of the requirement for secondary antibody specificities.

