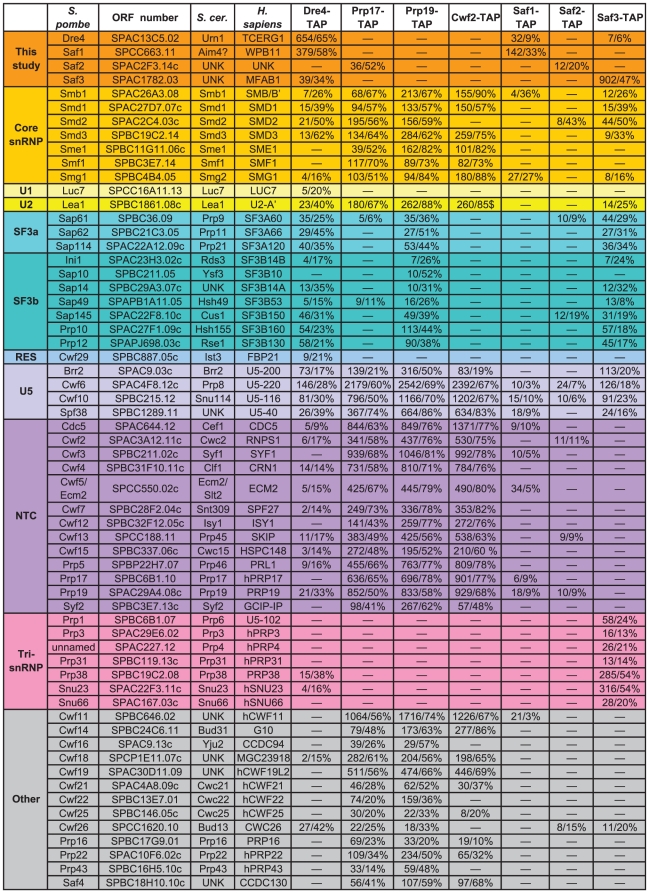
Figure 3. Mass spectrometric analysis of S. pombe splicing associated factors.
Proteins are categorized by sub-complex with the number of spectral counts and percent sequence coverage provided. Components present at less than 5% sequence coverage or with less than five distinct peptides were not included in the compilation of splicing factors based on subcomplexes. Full analyses of mass spectrometric data are provided in Tables S2 and S3. UNK = unknown.

