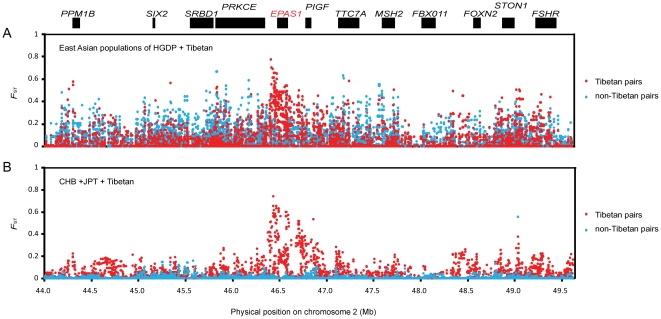
Figure 3. Pairwise F ST values of the EPAS1 gene and its surrounding regions.
The plots of locus-by-locus pairwise F ST of East Asian Populations of HGDP (including Yi, Mongolian, Duar, Lahu, and Cambodian) + Tibetan (A), and CHB, JPT, and Tibetan pairs (B) are shown. The x-axis of each plot is the physical position (Mb) on Chromosome 2. The y-axis of each plot is the value of pairwise F ST. Each dot of the plots represents a pairwise F ST of a SNP. The extremely high F ST are mostly located within the EPAS1 gene.

