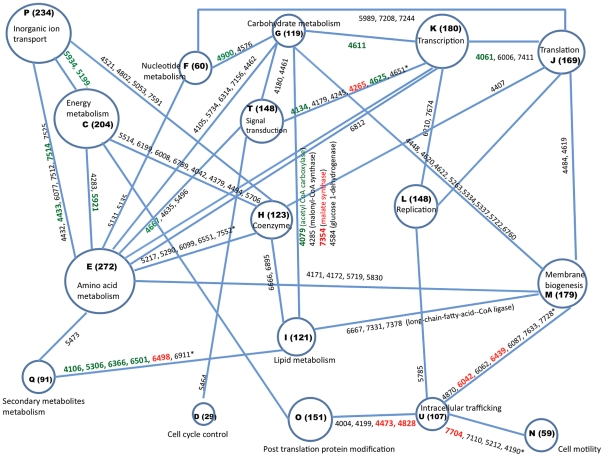
Figure 3. Metabolic network showing the number of O. carboxidovorans proteins identified in each COG category in the current study.
Proteins (referred by locus tag number OCAR_xxxx) listed on lines connecting COG categories are classified in both COG categories. Proteins that showed significantly increased expression in syngas and acetate medium compared to TSB medium are colored red, and proteins that had significantly decreased expression in syngas and actetate medium are green. The size of the circles represents the number of proteins in that COG. Protein names and COG groups along with their GI and other details can be accessed from NCBI (http://www.ncbi.nlm.nih.gov/genome?Db=genome&Cmd=Retrieve&dopt=ProteinTable&list_uids=23052). The COG categories indicated are the same as in Figure 2. *Indicates additional proteins classified in both COG categories not shown in the figure.

