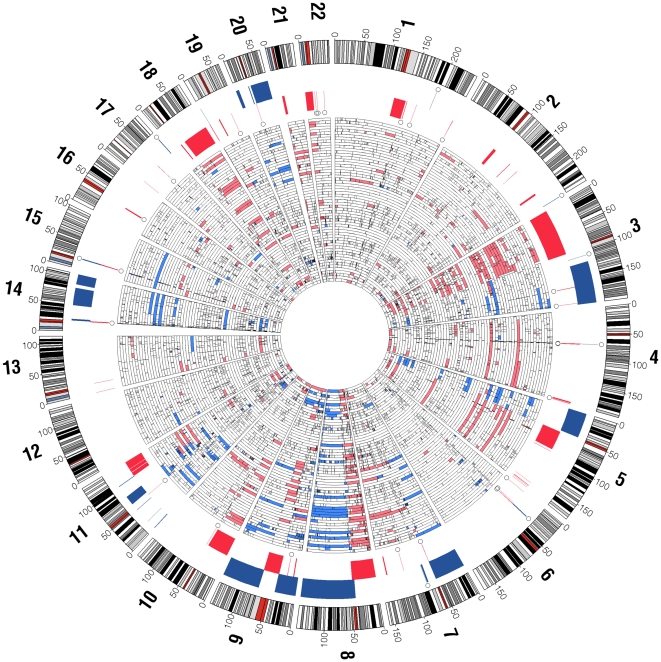
Figure 1. Radial heatmap of recurring copy-number alterations (CNAs) in OSCC.
Shown in the inner heatmap are copy number gains/amplifications (blue) and losses/deletions (red), where tumors are stacked radially. Significantly recurring alterations (RAE q-value <0.1) are displayed between the outermost chromosome ideograms and the inner heat map (red: losses, blue: gains). Open circles denote known copy-number variants (CNVs) that span more than 50% with recurring CNAs. Chromosome numbers are shown in bold at periphery of chromosome ideograms with genomic coordinates in megabases.

