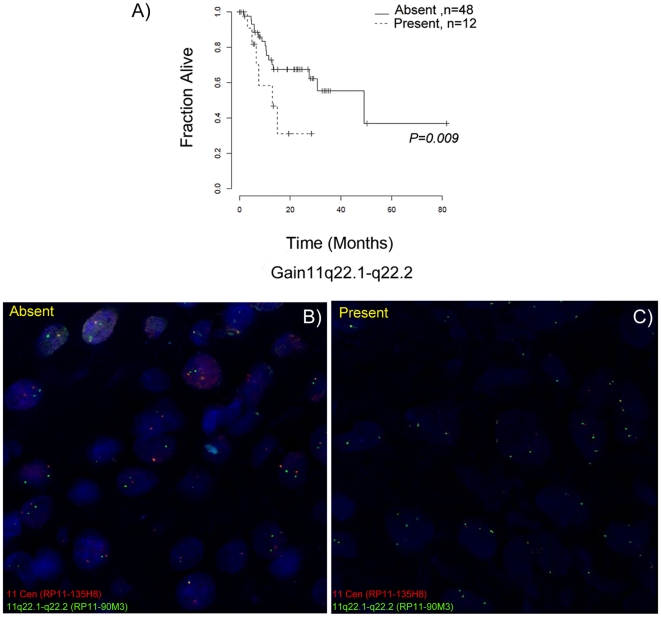
Figure 4. Patient survival curves and FISH validation of 11q22.1-q22.2 gain.
A) Kaplan-Meier survival estimates of patient groups with and without gain of chromosome 11q22.1–q22.2; survival in months (x-axis) is plotted against the fraction of samples alive (y-axis). Interphase FISH analysis detecting the chromosome 11 centromere (red) and the 11q22.1–q22.2 region (green), B) A case without 11q22.1-q22.2 gain and C) A case of 11q22.1–q22.2 gain are shown.

