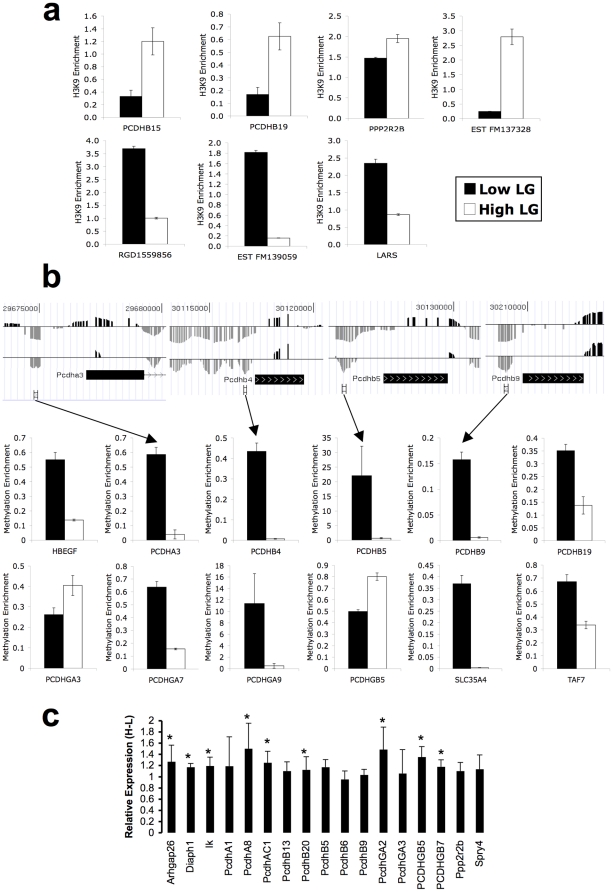
Figure 1. Microarray validation.
(a) H3K9 acetylation differences between High (white bars) and Low LG (black bars) adult offspring validated by qCHIP (see Methods). (b) (upper) DNA methylation differences between High and Low LG adult offspring detected by microarray analysis (H–L), showing gene location, and region analyzed. (lower) DNA methylation differences validated in the same manner as for H3K9 acetylation. (c) Gene expression differences between High LG and Low LG adult offspring (* = P<0.05). All real-time PCR reactions were performed in triplicate and results are displayed as mean +/− SEM.

