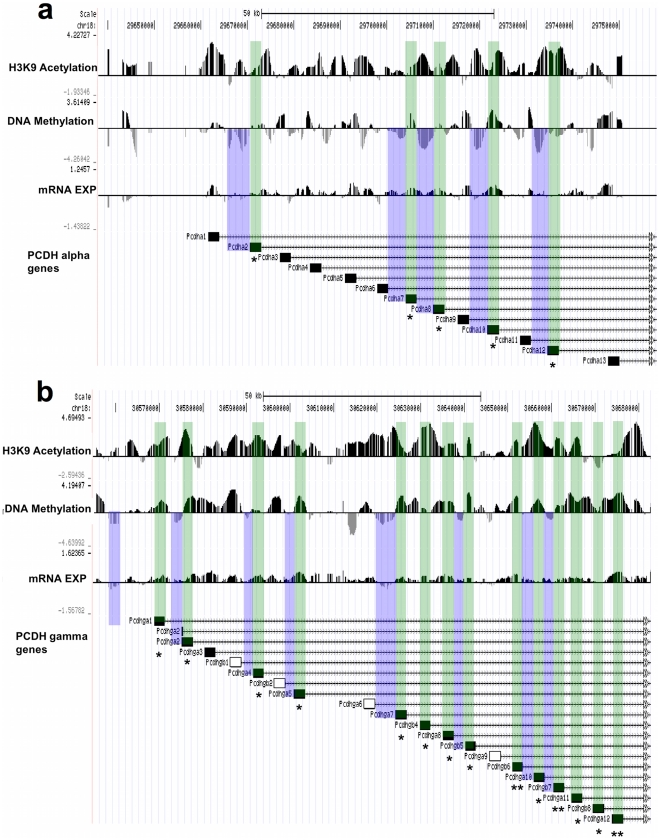
Figure 5. Epigenomic neighborhoods of the first exons in protocadherin gene clusters.
Genes with hypomethylated 5′ gene ends (blue), hypermethylated and hyperacetylated exons (green) and significantly greater gene expression among High compared to Low LG adult offspring (H–L) are shown for (a) protocadherin-α, (b) protocadherin-γ gene clusters. Gene expression differences of genes surveyed by quantitative RT-PCR (filled boxes; ** = P<0.01, * = P<0.05) are shown relative to the location of other nearby Pcdh genes within each cluster (unfilled boxes).

