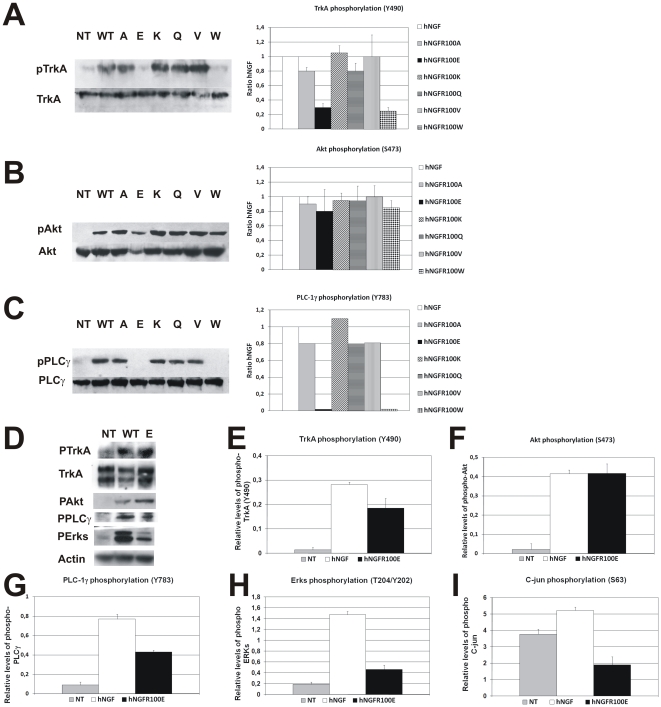
Figure 1. Activation of TrkA and p75NTR signaling by hNGF mutants.
Western blot and densitometric analysis of (A) TrkA (Y490), (B) Akt/S473), and (C) PLC-γ1 (Y783) phosphorylation, in extracts from BALB/C 3T3 TrkA cells, stimulated by 100 ng/ml of hNGF and hNGFR100 mutants. D, Western blot of phospho-TrkA (Y490), Akt (S473), PLC-γ1 (Y783) and Erks (T204/Y202) in PC12 cells, stimulated by 5 ng/ml of hNGF and hNGFR100E mutant. E, Densitometric analysis of phospho-TrkA. F, Densitometric analysis of phospho-Akt. G, Densitometric analysis of phospho-PLC-γ1. H, Densitometric analysis of phospho-Erks. I, Densitometric analysis of phospho c-jun in hippocampal neurons. The experiments were performed in triplicate. Bars represent the mean ± s.e.m.

