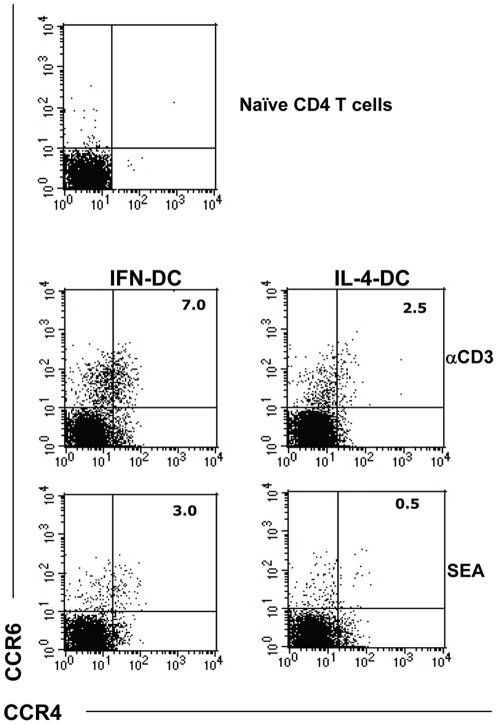
Figure 4. Estimation of the emergence of Th17 cells by analysis of surrogate cell marker expression.
Dot plot analysis of the expression of CCR6 and CCR4 on CD4 T cells after a 6-day stimulation with SEA or anti-CD3 coated beads in the presence of autologous DC. The results of one representative experiment out of five independently performed are shown. In all cases, the analysis was performed on electronically gated CD4+ T cells.

