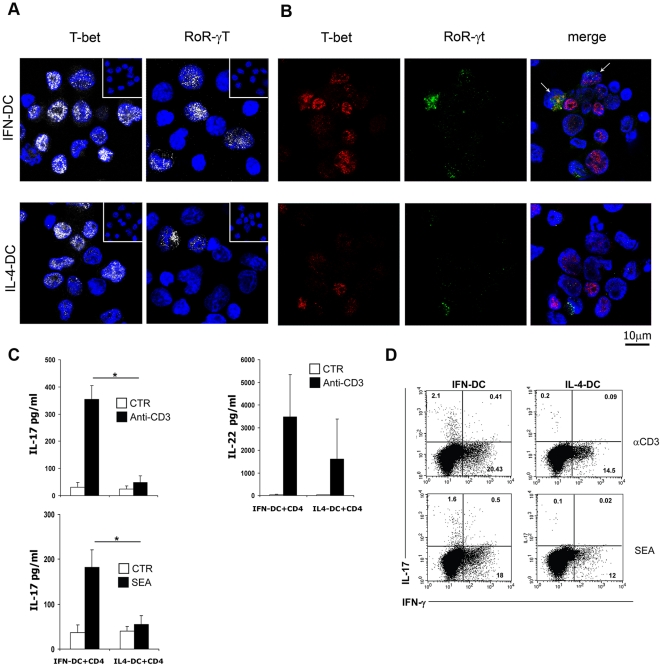
Figure 5. Expression of T-bet and RoR-γt transcription factors. IL-17 and IL-22 production by CD4 T cells stimulated in the presence of IFN-DC.
A) CLSM analysis (central optical sections) was performed on CD4 T cells activated by anti-CD3-coated beads in the presence of autologous DC for six days to evaluate the expression of the transcription factors T-bet and RoR-γt (pseudo-color grey). Cell nuclei were stained with DAPI (blue). Insets represent background labelling of isotype control antibodies. One representative experiment out of three independently performed is reported. B) Co-expression of the transcription factors T-bet (red) and RoR-γt (green) in CD4 T cells activated with anti-CD3-coated beads in the presence of autologous DC for six days, as observed in a representative experiment out of three. Cell nuclei were stained with DAPI (blue). One representative experiment out of three independently performed is reported. C) Production of IL-17 and IL-22 in the culture supernatants of CD4 T cells stimulated in the presence of autologous DC. Naïve CD4 T cells were stimulated with SEA or anti-CD3 in the presence of autologous DC for six days. The values represent the mean +/− SD of four independent experiments. Statistical analysis was performed by Mann-Whitney test. * p<0.05. D) Production of IL-17 by a fraction of CD4 T cells, as demonstrated by intracellular cytokine staining. The dot plot analysis, representative of one out of five experiments, shows the intracellular IFN-γ and L-17 expression by CD4 T cells primed with SEA or anti-CD3 in the presence of autologous DC for six days. Upon activation with PMA/ionomycin in the presence of brefeldin-A for 5 hours, as described in Materials and Methods, cells were stained for the CD4 antigen, permeabilized and stained for intracellular IFN-γ and IL-17. Analysis was performed on electronically gated CD4+ T cells.

