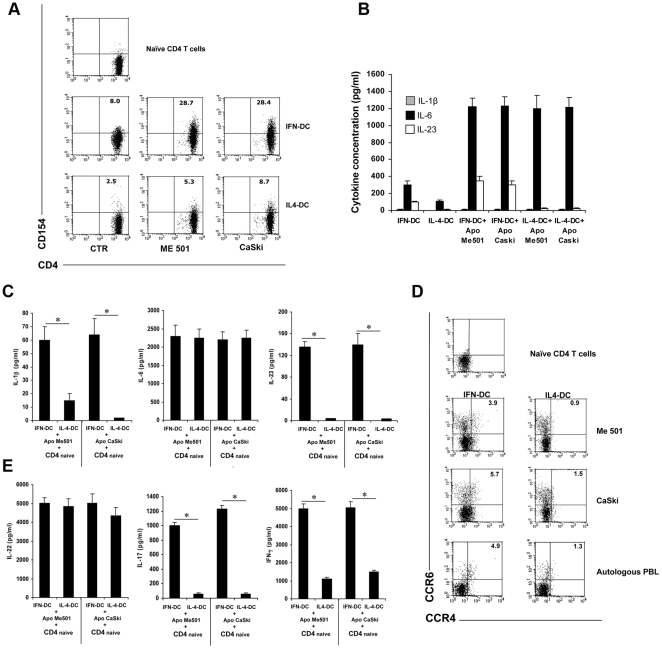
Figure 7. Induction of Th17 response by DC loaded with apoptotic cells.
A) Representative dot plot analysis (one out of three) of CD154 induction in CD4 T cells after 6 days of culture with autologous IFN-DC or IL4-DC fed with apoptotic cells. The upper dot plots show CD154 expression in purified naïve CD4 T cells prior to use. CTR dot plots show the percentage of CD154 expression by CD4 T cells cultivated in the presence of autologous DC which had not phagocytosed apoptotic tumor cells. Analysis was performed on electronically gated CD4+ T cells. The percentage of early and late apoptotic tumor cells was evaluated by Annexin-V/propidium iodide staining. B) ELISA detection of IL-1β, IL-6 and IL-23 release by DC upon phagocytosis of apoptotic tumor cell lines. Analysis was performed after 18 hours from tumor cell uptake. The values represent the mean +/− SD of three independent experiments. C) ELISA detection of IL-1β, IL-6 and IL-23 in supernatants from co-culture of CD4 T cells with autologous DC which had phagocytosed apoptotic cells. After three days of co-culture, CD4 T cells were restimulated overnight with anti-CD3 coated beads. At day four the supernatant was collected for cytokine detection. All data are expressed as the mean +/− SD of three independent experiments. Statistical analysis was performed by Mann-Whitney test. * p<0.05. D) Dot plot analysis of CCR6/CCR4 expression by CD4 T cells after six days of stimulation in the presence of DC fed with apoptotic tumor cells or autologous PBL. The results of one representative experiment out of three are shown. In all case, the analysis was performed on electronically gated CD4+ T cells. E) Evaluation of IL-22, IL-17 and IFN-γ production at day 4, after overnight restimulation of CD4 T cells with anti-CD3 coated beads. All data are representative of one out of three independent experiments performed with cells derived from different donors. The values represent the mean +/− SD of three independent experiments. Statistical analysis was performed by Mann-Whitney test. * p<0.05.

