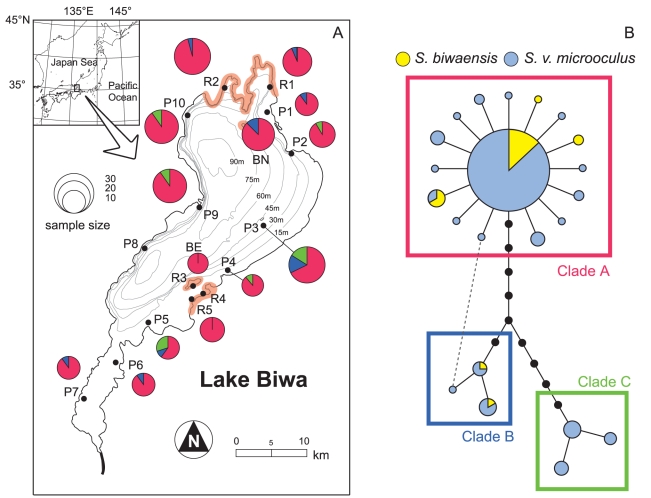
Figure 1. Sampling localities and mtDNA haplotype group frequencies of Sarcocheilichthys in Lake Biwa, Japan (A).
Northern and eastern rocky zones are shaded in orange. Statistical parsimony network for mtDNA of Sarcocheilichthys (B). The areas of the circles are proportional to haplotype frequency. A dashed line indicates an alternative connection (loop). In both (A) and (B), each clade is shown in the same color. Sample codes correspond to those in Table 1.

