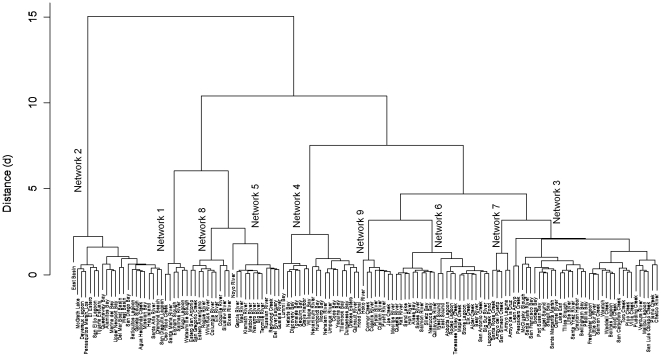
Figure 4. Dendrogram showing hierarchical division of estuary networks and agglomeration schedule.
The hierarchical clustering identified nine substantive networks at a Euclidean distance of 2.5. Major divisions are by development (Network 2; d = 16), impaired inflows (Networks 1, 5, 8; d = 10), and approved shellfish growing areas (Networks 4; d = 7.5).

