
Figure 1. Analysis of α-synuclein and synaptophysin in fractionated Parkinson's disease tissues.
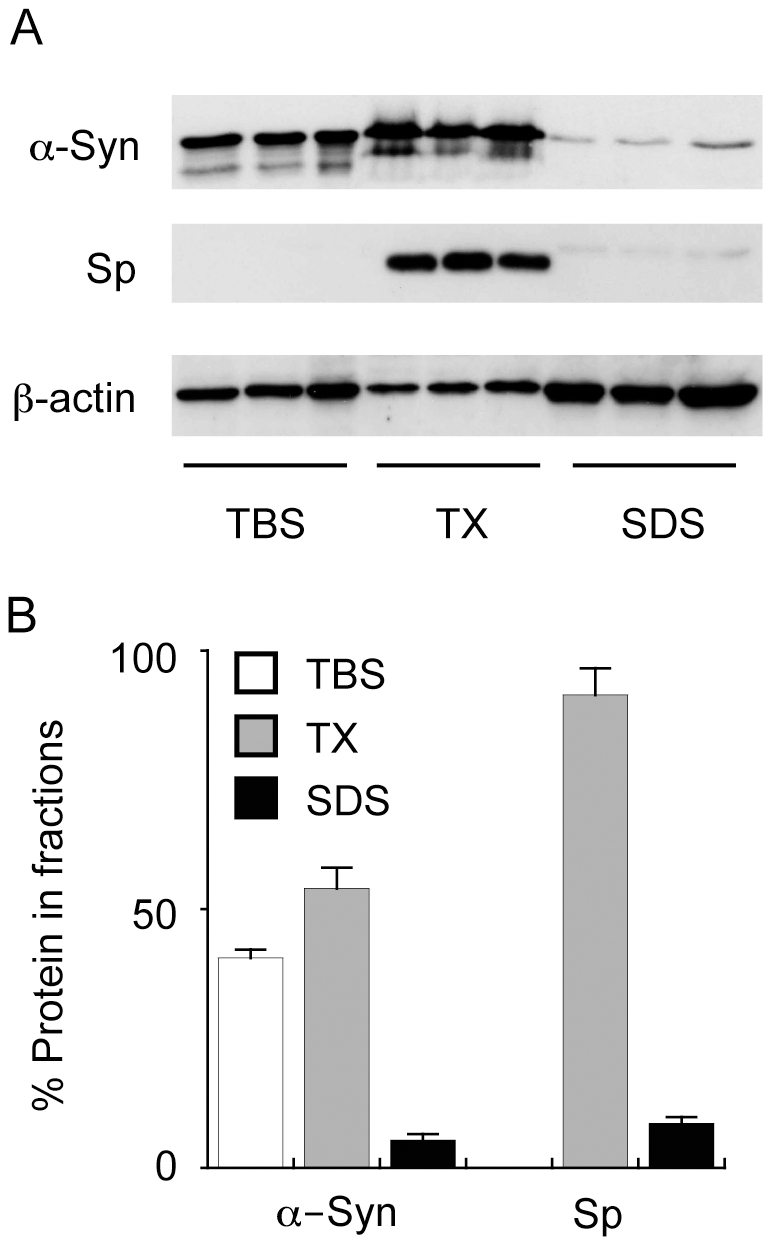
Tissues were homogenised into three fractions that contained tris-buffered saline (TBS), TBS containing Triton X100 (TX) or sodium dodecyl sulphate (SDS) and α-synuclein (α-Syn), synaptophysin (Sp) and β-actin expression was analysed by Western blotting (A). The intensity of the bands was measured and the relative amounts of α-Syn and Sp in each fraction is expressed in the histogram (B). The data are derived from Parkinson's disease amygdala (PD AMY) samples and are used as an example to illustrate the techniques used to characterise the PD tissues. Data in “B” represent mean values with SEM shown by the error bars for the three samples shown in “A”.