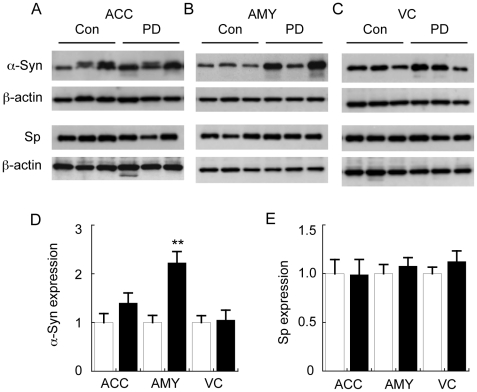
Figure 2. Analysis of control (Con) and Parkinson's disease (PD) α-synuclein (α-Syn) and synaptophysin (Sp) levels.
Tissues were homogenised and fractionated as described in the legend to Figure 1 and insoluble α-Syn in the SDS fraction, and Sp in the TX-fraction was measured in the anterior cingulate cortex (ACC) (A), amygdala (AMY) (B), and visual cortex (VC) (C). Corresponding quantification of relative α-Syn (D) and Sp (E) protein expression in the three brain regions is provided in the histograms. Data represent mean ± SEM (n = 10), **p<0.001 by t-test.

