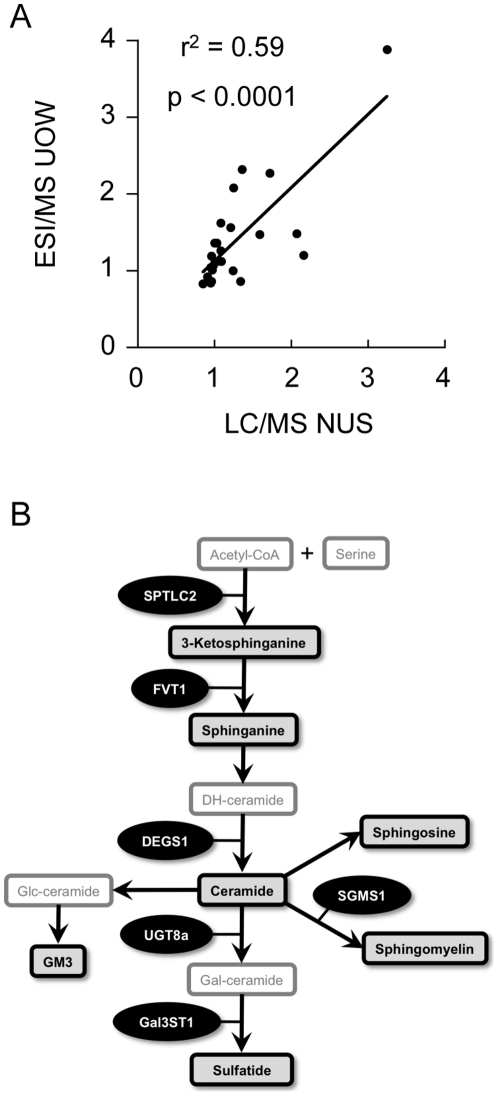
Figure 4. Comparison of liquid chromatography-mass spectrometry (LC/MS; National university of Singapore, NUS) and electrospray ionisation mass spectrometry (ESI/MS; University of Wollongong, UOW) techniques for the detection of sphingolipid changes in control (Con) and Parkinson's disease (PD) tissues.
Independent aliquots of Con (n = 10) and PD (n = 10) tissues were collected from the anterior cingulate cortex, amygdala and visual cortex. Lipids were extracted and analysed using LC/MS lipidomics at NUS (LC/MS NUS) and ESI/MS at UOW (ESI/MS UOW). The fold-change in lipid levels of the PD samples relative to the controls is provided in the scatter plot that compares the data from the two laboratories (A). A simplified schematic diagram of relevant sphingolipids and related genes assessed in this study is provided (B). The lipids in the boxes with black borders were analysed in the present study. Serine palmitoyltransferase, long chain base subunit 2 (SPTLC2); follicular lymphoma variant translocation 1 (FVT1); degenerative spermatocyte homolog 1; lipid desaturase (DEGS1); sphingomyelin synthase 1 (SGMS1); UDP galactosyltransferase 8A (UGT8A); and galactose-3-O-sulfotransferase 1 (GAL3ST1). Pearson correlation analysis indicates a positive correlation between the independent analyses (p<0.0001).

