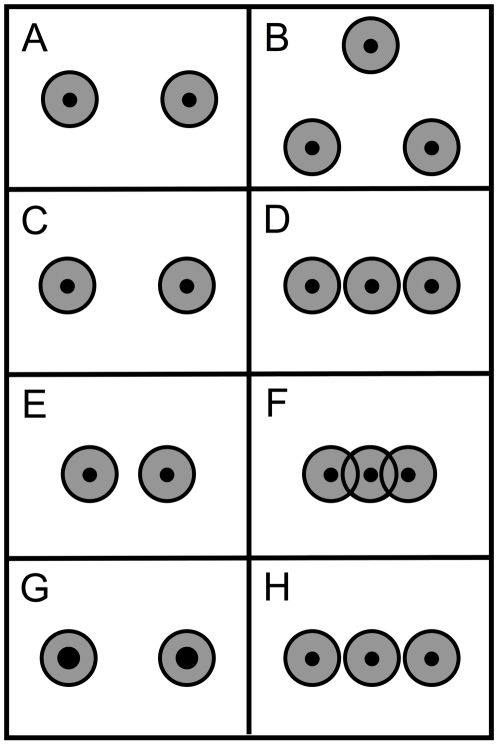
Figure 1. Influence spheres of numerosities containing either two or three items.
The black dots have a numerosity of two in Panels A, C, E, and G and a numerosity of three in Panels B, D, F, and H. In Allik & Tuulmets's occupancy model [14], a numerosity estimate is given by the total area (occupancy) covered by the disk-shaped influence spheres (the set-theoretical union of the gray regions, including the black dots). From Panel A to Panel B, holding density constant, numerosity and occupancy are increased by increasing the collection's spatial extent. From Panel C to Panel D, holding spatial extent constant, numerosity and occupancy are increased by increasing the collection's density. From Panel E to Panel F, holding spatial extent constant, numerosity and occupancy are increased by increasing the collection's density, but due to the resulting overlap between the influence spheres, the occupancy is smaller in Panel F than in Panel D. From Panel G to Panel H, holding the combined surface area of the dots constant, numerosity and occupancy are increased by increasing the collections density. Thus, the model's numerosity estimate is the same in Panels A, C, E, and G and in Panels B, D and H. In Panels B, D, F, and H, it is larger than in Panels A, C, E, and G, but in Panel F it is smaller than in Panels B, D, and H. In Durgin's version of the model [17], [18], influence-sphere size decreases with dot density, and occupancy is normalized by dividing it by influence-sphere size.

