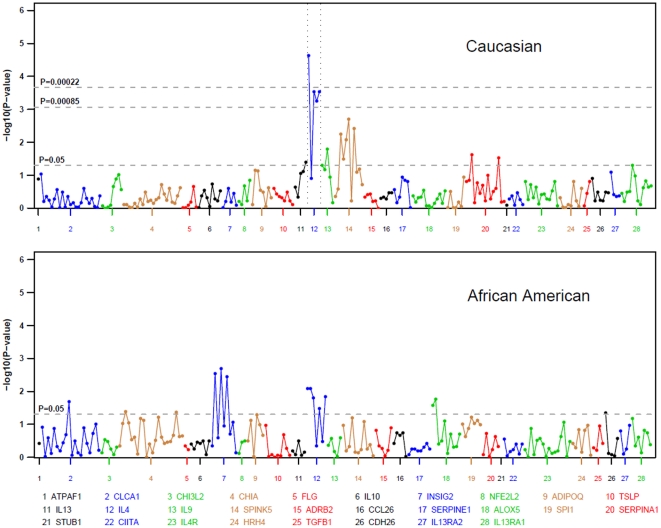
Figure 1. Associations between European and African Ancestry asthmatics vs. non-allergic controls.
Associations between the 230 total SNPs within the 28 candidate genes were tested using the additive model after adjusting for age, gender and population stratification. The upper line corresponds to the conservative Bonferroni adjusted p value 0.00022. The middle line corresponds to the Bonferroni adjusted p value 0.00085 considering a LD correlation of 0.25. SNPs significant at this level (all in IL4) include rs2243250, rs243268, rs2243274 and rs43282. The lower line is a nominal significance p value = 0.05. SNPs are plotted on the x-axis according to their position on each candidate gene across the chromosome against association with asthma on the y axis (shown as log10 p value).

