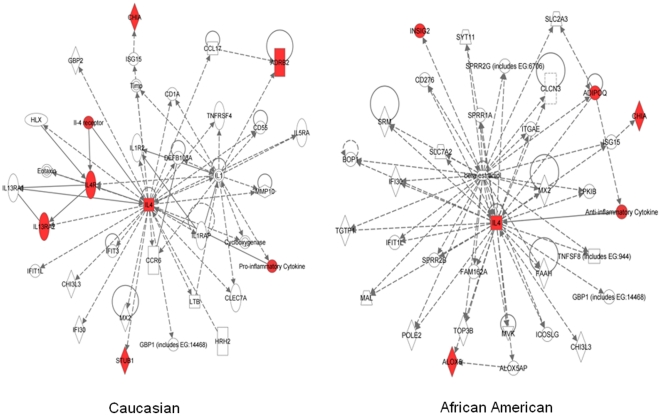
Figure 4. Ingenuity Pathway Analysis (IPA) Interactive network.
IPA network for recursive partitioning prioritized genes. Genes with red node are focused genes in our analysis, others are generated through the network analysis from the Ingenuity Pathways Knowledge Base (http://www.ingenuity.com). Edges are displayed with labels that describe the nature of the relationship between the nodes. All edges are supported by at least one reference from the literature, or from canonical information stored in the Ingenuity Pathways Knowledge Base. Edges are displayed with labels that describe the nature of the relationship between the nodes. The lines between genes represent known interactions, with solid lines representing direct interactions and dashed lines representing indirect interactions. Nodes are displayed using various shapes that represent the functional class of the gene product. Nodes are displayed using various shapes that represent the functional class of the gene product (see legend).

