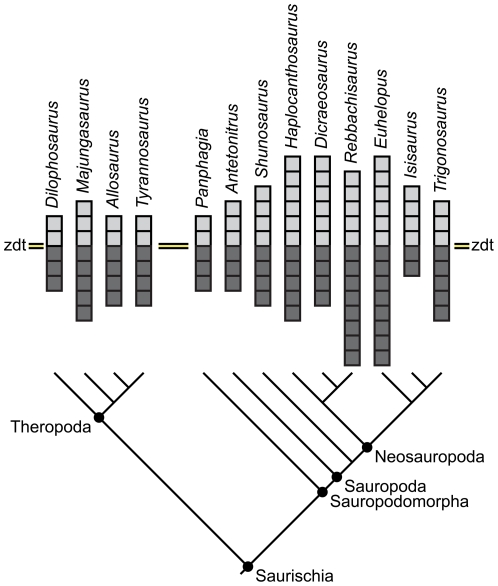
Figure 14. Neural arch fossa morphospace.
Comparative diagram illustrating relative complexity of neural arch fossae in four theropods and nine sauropodomorphs. light gray squares represent unique fossae above the zygodiapophyseal table; dark gray squares represent unique fossae below the table. Unique fossae are defined as midline fossae and either the right or left paramedian fossae. Midline fossae that are subsequently divided count as two unique fossae. Therefore, a vertebra with two midline fossae (the sprf and spof) and two paramedian fossae (the prsdf and the posdf) is represented by four light gray squares. If a similar vertebra has a divided sprf but is otherwise identical, it is represented by five light gray squares. Note the general increase in complexity above and below the table in Neosauropoda compared to basal eusauropods (e.g., Shunosaurus), basal sauropods (e.g., Antetonitrus), basal sauropodomorphs (e.g., Panphagia), and theropods, although reduced complexity does occur in Dicraeosaurus and Isisaurus. Tree topology is based on several recent phylogenies [34], [46], [60], [61].

