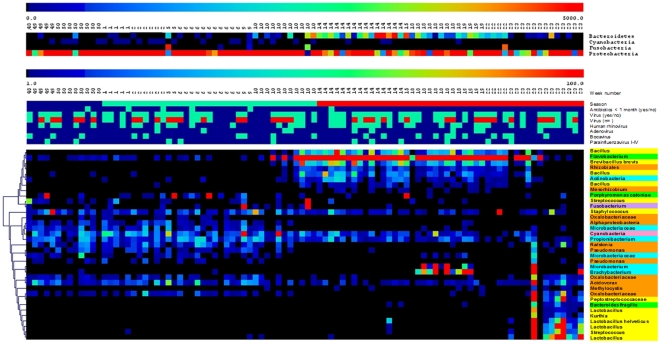
Figure 3. Seasonal differences between microbiota profiles of 50 children sampled in fall-winter and 46 children in spring.
The samples are marked by the week number they were obtained (week 48 until week 23). In figure 3a the phyla showing significant association with season of sampling by SAM analysis are depicted. In figure 3b the OTUs showing significant association with season are depicted. The samples are marked by season (blue; fall, green; winter, red; spring), antibiotic use (<1 month: green), presence of viruses (positive: green), presence of multiple viruses (green: 1 virus, red: ≥ 2 viruses), Presence of Human rhinovirus, Adenovirus, Bocavirus, and Para-influenzavirus I-IV (positive: green). Groups of OTUs belonging to specific phyla are depicted with separate colours; Yellow: Firmicutes, Orange: Proteobacteria, Green: Bacteroidetes, Blue: Actinobacteria, Pink: Cyanobacteria.

