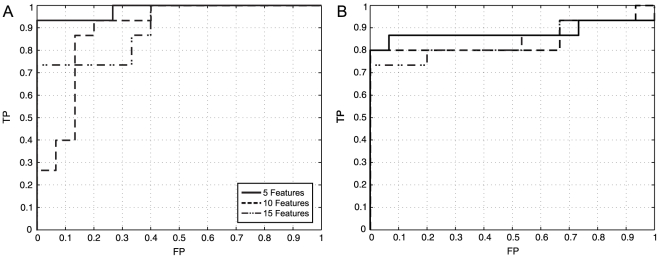
Figure 7. ROC curves.
(a) For MLP neural networks, (b) RBF neural networks obtained from the classification of the HRV test records using 5, 10 and 15 top features selected by KS-test; the areas under the curves are equal to 0.9822, 08889 and 0.9024 for MLP and 0.8800, 0.8667 and 0.8400 for RBFNN, respectively.

