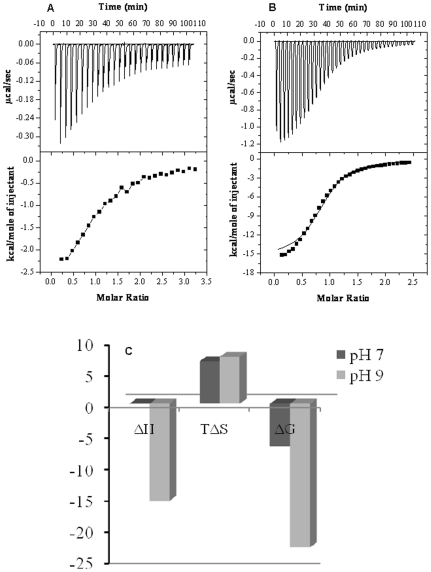
Figure 2. Isothermal titration calorimetry of HSA complexed with creatinine.
The ITC experiments of N and B isomers of Human serum albumin at pH 7.0 (A) and 9.0(B) respectively were performed at 25°C. In the top panels, the heat released per unit time (µcal/sec) was plotted vs time where each peak corresponds to the injection of an aliquot of ligand. In the bottom panels, the heat of reaction per injection (kcal/mole) was determined by integration of the area under each peak, plotted vs [CTN]/[HSA], and fit using the software provided by Microcal. (C) Comparative distribution of ΔH, TΔS and ΔG at pH 7.0 (dark grey) and pH 9.0 (light grey).

