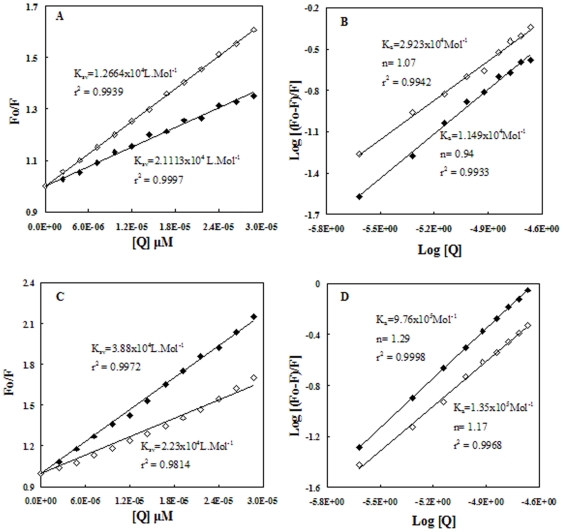
Figure 5. Fluorescence quenching of HSA with creatinine at different ligand/protein ratios.
Stern-Volmer (A&C) and modified Stern-Volmer (B&D) plots of N (A&B) and B (C&D) isomeric conformations of HSA with uremic toxin creatinine. Each data point was the mean of 3 independent observations (S.D. ranging 0.03–0.4%). The Protein was excited at 280 (♦) and 295 nm (◊).

