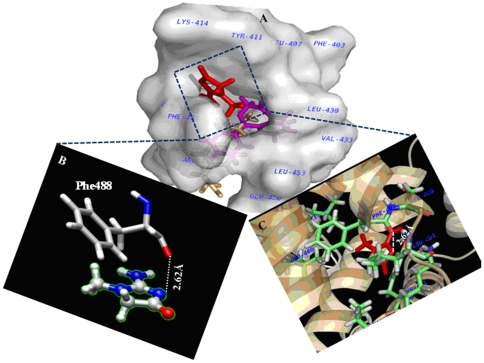
Figure 9. Molecular docking of HSA complexed with site II specific markers.
(A) Molecular surface representations of HSA showing site II specific markers [ibuprofen (light orange); diazepam (magenta)] and the toxin CTN (red) at binding site II. (B) The toxin molecule forming repulsive interaction (white colour) with Phe488 of HSA (as highlighted by the white dashed line). (C) Other site II amino acid residues of HSA interacting with CTN within 5 Å distance.

