
Fig. 4.
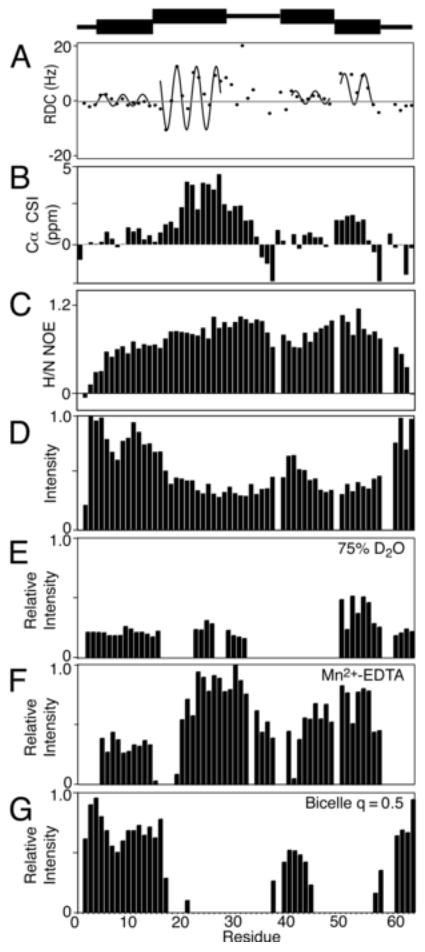
Secondary structure plots of p7 in DHPC micelles. (A) 1H-15N Residual Dipolar Couplings are plotted with the dipolar waves superimposed. (B) Cα chemical shift index values, (C) 1H-15N Heteronuclear NOEs. (D) 1H-15N HSQC intensities. (E) Relative intensity plots for a sample containing 75% D2O (F) PRE data from a sample containing 10 mM Mn2+-EDTA (G) Intensities from an isotropic bicelle sample with q = 0.5 (G). A schematic representation of the seven structural elements of p7 is at the top of the Figure.