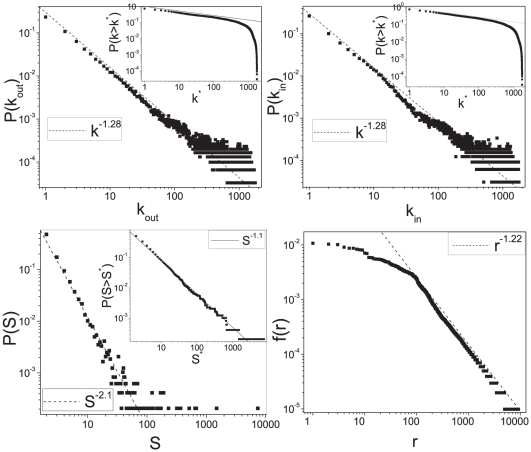
Figure 5. The stochastic model representing the semantic space.
Results for the simulation of the stochastic model representing the semantic space. This is a simulation of a toy-model for an encyclopedia of  pages with size
  log-normally distributed, with first moment
  and second moment
  . The parameter of the model are
  ,
,  and
and  . In the top panels the out-degree distribution
  (left panel) and the in-degree distribution
  (right panel) of the semantic network at the percolation threshold are shown. The corresponding cumulative distributions
  are displayed in the insets. In the bottom left panel we show the cluster size distribution
  at the percolation threshold, the relative cumulative distribution
  is displayed in the inset. In the right bottom panel we show the frequency-rank distribution
  for the words in the model.

