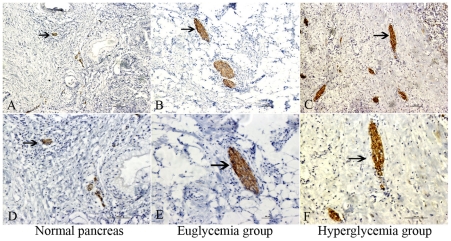
Figure 1. Nerve tissue immunostaining in different group.
PGP 9.5 immunostaining in the normal pancreas (A, D, arrowhead), pancreatic cancer in euglycemia group (B, E, arrowhead), and hyperglycemia group (C, F, arrowhead). A, B, C show an original magnification of 100×, and D, E, F an original magnification of 200×. In the hyperglycemia group, comparable increases in the number, area, and diameter of nerve tissues were present. Figure arrowheads indicate the immunostainings.

