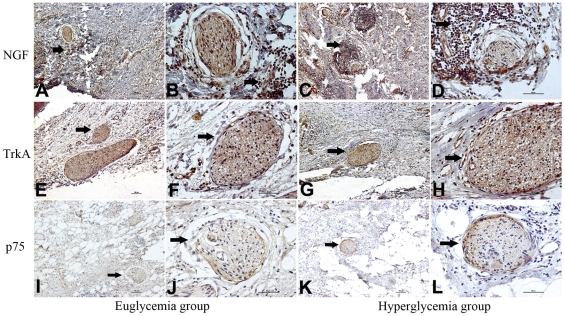
Figure 3. NGF, TrkA, and p75 immunostaining of pancreatic cancer tissue in the euglycemia group and hyperglycemia group.
A, C, E, G, I, K show an original magnification of 100×, and B, D, F, H, J, L an original magnification of 400×. The frequency of moderate to strong NGF staining of cancer cells was significantly higher in the hyperglycemia group than that in the euglycemia group (arrowhead). The NGF stain of nerves was not significantly different between the two groups. The moderate to strong TrkA stainings were also present in the two groups (arrowhead) but with no significant difference. The frequency of moderate to strong p75 staining of nerves (arrowhead) was significantly higher in the hyperglycemia group than that in the euglycemia group. Figure arrowheads indicate the immunostainings.

