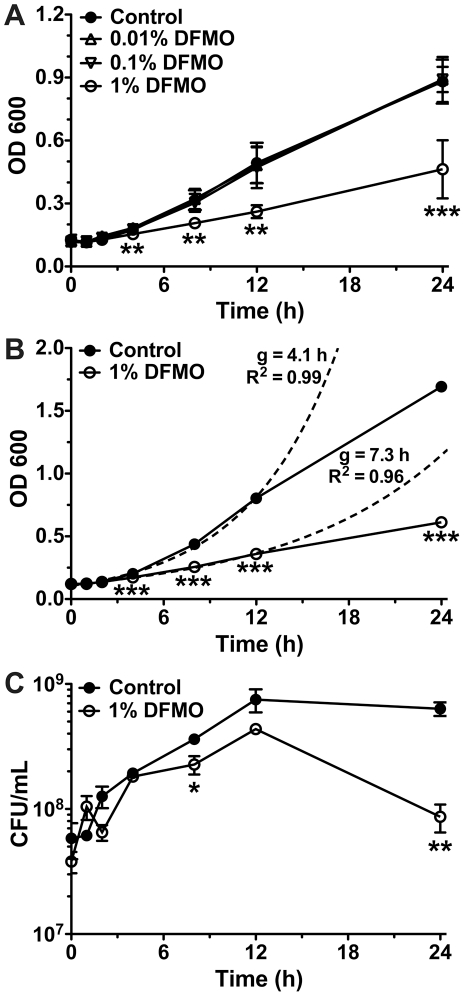
Figure 1. DFMO suppresses the growth of H. pylori.
Brucella broth cultures, some containing DFMO, were inoculated with H. pylori SS1 at an OD600 of ∼0.1 and growth was monitored for 24 h. (A) Bacteria were grown in control broth or broth supplemented with 0.01%, 0.1%, or 1% (w/v) DFMO and growth was monitored by measuring OD600 at the indicated time points. Solid lines depict the growth curve obtained for each treatment and error bars represent the standard error (n = 3). (B) H. pylori were grown and monitored as described for panel A in control broth or broth with 1% DFMO. Solid lines are experimentally obtained growth curves, with standard errors (n = 9), while the dashed lines indicate the calculated exponential regression curves using the first 12 h of data. The generation time (g) and goodness of fit (R2) are indicated for each curve. (C) Bacteria were cultured as in panel B, and at the indicated time points samples were collected, diluted and plated on solid medium. Colonies were counted once visible to calculate concentrations of viable bacteria. Solid lines depict the growth curve obtained for each treatment and error bars represent the standard errors (n = 3). For all graphs, *, p<0.05; **, p<0.01; ***, p<0.001 versus the control condition.

